Factors Affecting Competitiveness in State Legislative Elections
![]() This Ballotpedia article is in need of updates. Please email us if you would like to suggest a revision. If you would like to help our coverage grow, consider donating to Ballotpedia.
This Ballotpedia article is in need of updates. Please email us if you would like to suggest a revision. If you would like to help our coverage grow, consider donating to Ballotpedia.
Published in August 2012
This report examines the relationship between the size of a state legislative district in each state, the compensation given to state legislators in each state, the one-party dominance of state legislatures in each state, and the competitiveness of state legislative elections. This report finds no conclusive evidence, using ordinary least squares regression analysis, of a relationship between the size of a state legislative district and its electoral competitiveness, between the dominance on one party and the competitiveness of state elections, or between the compensation given to state legislators and the competitiveness of these elections.
Background
State Legislative Salaries
With public trust in major institutions[1][2] and state government[3] sagging across the United States in recent years, the job performance of state legislators during recent periods of slow economic growth and budget constraints has become an issue in some states. Government largess and high levels of spending remain unwelcome prospects to many U.S. residents, and the people elected to make decisions for these public institutions sometimes fail to win approval as well.[4] In California, where the nation's highest-paid state legislators work, public disapproval of the state legislature's job performance among all adults is at 57 percent, and is over 70 percent among likely voters.[5][6] Usually, legislators have control over their own pay, and the public is generally skeptical of attempts by the legislature to raise the salaries for representatives and senators.[5] This public skepticism results in some politicians supporting limits to pay for state legislators, including a constitutional amendment in Alabama.[7]
However, these trends are not universal, and some state government observers have made arguments for higher legislative pay. State legislative salaries have generally been outpaced by private sector compensation, and talented individuals who would serve the public and perform well as state legislators may be attracted to the higher salaries of private industry or other government offices. Low state legislative salaries also discourage those who earn a low income or do not independently hold considerable wealth from running and serving, which can lead to a lack of socioeconomic diversity in legislatures.[5] This lagging pay comes at a time when state legislators are dealing with more complex issues and spending more time serving fulfilling their duties.[5] This has become a minor point of discussion in New Hampshire, where state legislators receive a constitutionally-set salary of $100 per year.[8] As state budgets get more complex and state legislative actions become more controversial, the public may demand more competent legislators; one way to create the supply of better candidates may be to raise legislative salaries.
District Size
The size of state legislative districts vary considerably between states. Although most states have between 80 and 200 state legislators, state populations range from Wyoming's 563,000 residents (and 90 state legislators) to California's 37,254,000 residents (and 120 state legislators). These discrepancies mean that state legislators and candidates face vastly different electorates and, if they are lucky enough to win their elections, duties to their constituencies. These changes may also influence the decisions of potential candidates. Running successfully for state senate in California is a bigger undertaking, in terms of population, than running for the U.S. House of Representatives; a state senator in California represents 931,000 people. A state senator in North Dakota, on the other hand, only represents 14,000 residents. For a potential candidate with relatively limited resources seeking to win an election, winning election in smaller legislative districts may seem like a more feasible and more attractive goal than competing in and serving mammoth, high-population constituencies. Conversely, larger state legislative districts may mean that an incumbent is more likely to face a challenger, as higher population districts are more likely to include residents that have both the means and the interest to face an incumbent. This latter hypothesis, however, still faces the resource constraints associated with large districts, and may only apply to very large districts with considerable economic and political diversity.
Partisan Control in States
Throughout the history of U.S. political parties, politics in some states have remained decidedly dominated by one party. For much of the first half of the twentieth century, Democrats thoroughly controlled politics in the southeastern United States. Georgia gubernatorial elections provide an example of this control; with the exception of one Democrat-Whig, who served as governor for a few months in 1882 and 1883, every governor of Georgia who served between 1872 and 2003 was a Democrat.[9] Vermont experienced similar dominance by the Republican Party over a similarly long amount of time.[10]
Notably, these levels of dominance have shifted between midcentury and the modern day, but the essential monopoly on political power exerted by one party in a state may affect the competitiveness of its elections.[11] In these states, the primary is often more important than the general election, but political party leadership often prefers to avoid primaries to promote internal party unity and avoid unneeded resource expendiutre.[12][13] The number of primary contests can be considered a measurement of party strength and discipline, with fewer primaries suggesting stronger party leadership.[14] Thus, parties might prefer to discourage primaries to avoid taxing the resources of potential donors and to maintain party unity. Alternatively, parties may prefer primaries as a method of sustaining their voters' interest in the election, in which case a long primary might be beneficial.[15] Party leadership might also encourage a primary to boot out a problematic incumbent in a safe district, or to replace a sub-par incumbent with a better candidate in a district competitive with another party.
Theory
This report considers three theories, and makes some associated assumptions, in its analysis.
Increasing Compensation Increases Competition
First, this report seeks to explore the theory that potential state legislative candidates will become more likely to challenge incumbents or run for open seats as the compensation offered to state legislators in a given state increases. To analyze this theory, this report assumes that the effects of cost of living differentiations between states are not practically significant compared to the variation between legislative salaries across states. This analysis also assumes that potential state legislative candidates consider the salary and benefits offered by the position before running for office. Finally, this report also assumes candidates enter an electoral contest with the goal of winning the election.
Smaller District Sizes Promote Competitiveness
Second, this report seeks to explore the theory that potential state legislative candidates will become more likely to challenge incumbents as districts represent smaller populations. To analyze this theory, this report assumes that a potential candidate has limited resources, and that the potential candidate considers those resource limitations before declaring official candidacy. This report assumes that potential candidates consider smaller districts easier to contest and win. This analysis also assumes candidates enter an electoral contest with the goal of winning the election.
One-Party Control Discourages Competition
Third, this report seeks to explore the theory that potential state legislative candidates will become less likely to challenge incumbents if a single political party holds disproportionate sway over politics in the state. To analyze this theory, this report assumes that a state political party would rather have fewer contested primaries than more contested primaries, that state parties can increase the costs (real and perceived) for potential candidates that it does not want to enter an electoral contest, and that state parties can decrease costs (real and perceived) for their preferred candidates. This report also assumes that potential candidates that do not identify with the dominant party in the state are discouraged from running because of the dominant party's electoral power. Finally, this analysis also assumes candidates enter an electoral contest with the goal of winning the election.
Data and Methods
The data used in this analysis was collected by Ballotpedia staff members from various sources. The information on state legislative salaries was collected largely from the National Conference of State Legislatures.[16] Information on state populations came from the 2010 U.S. Census, and Ballotpedia staffers used information regarding the number of state legislators in each state to determine ideal district sizes for each relevant house of the state legislature.
Measuring Competitiveness
The Competitiveness Index, developed by Ballotpedia staff, is based on data collected by Ballotpedia staff members. The Index seeks to measure the level of competition for state legislative seats within a state using three factors. First, the Index considers the percentage of incumbents who are running for re-election that are facing a primary challenge in the state. Second, the Index considers the percentage of major party candidates in a state that face a major party (Republican or Democratic) opponent in the general election. Third, the Index considers the percentage of incumbents in a state that are retiring, or not running for re-election. To calculate the Absolute Competitiveness Index, which is used in this report as a proxy measure for overall competitiveness, the percentages associated with each of these factors (percent of incumbents facing primary, percent of major party candidates facing another major party candidate, and percent of incumbents retiring) are added together and divided by three. Thus, a score of "100," representing complete competitiveness, would mean that 100 percent of incumbents running for re-election face a primary challenge, 100 percent of major party candidates face another major party candidate in the general election, and 100 percent of incumbents are retiring. This scenario is not feasible and the index breaks down, but a scenario where only one incumbent is seeking re-election could yield a score very close to 100. Note that the opposite extreme, a score of "0," is possible, and all scores in between are possible. Competitiveness Index data for 2010 and 2011 were used in this report.
Finding Compensation Estimates
- See also: Comparison of state legislative salaries
To estimate compensation, this report considered both the salaries and the Per Diem compensation given to state legislators. For the purpose of this report, the authors assumed that a state legislature would earn, or consider earning before running for office, the maximum amount of compensation available. Thus, a state legislator would be given the maximum Per Diem benefits and spend the maximum amount of allowable expenditures. This estimated Per Diem amount is then added on to the salary to find a total compensation figure. The compensation amounts were based on compensation in the year 2011 or 2012, whichever was higher. Some states do not split the workload evenly for legislators between two years, and adjust their compensation accordingly. Specifically, states with elections in 2011 usually had higher levels of Per Diem compensation in 2012 than in 2011. When the number of days that Per Diem benefits applied to legislature was unclear, this report uses estimates based on the number of days in each session and published state legislative calendars to determine overall levels of compensation. In cases where the compensation levels varied between the lower house and the upper house, the average level of compensation was found and considered in order to match the average given by the Competitiveness Index.
Approximating Party Dominance
- See also: Party dominance in state legislatures
As a proxy measure for party dominance, this report uses the percent of seats in state legislatures controlled by one party as an indicator of party strength and dominance in the state. To calculate this percentage, and recognizing that no third party holds enough seats in any state legislative chamber to dramatically impact the two-party percentages (the Vermont State Legislature is the closest to an exception), the report uses the proportion of each chamber controlled by the Republican Party and an indication of GOP dominance (a high proportion), Democratic dominance (a low proportion), or a contested state (near 0.50). These two percentages are then added together to provide a measure of the degree to which Republicans control the state legislature (with 2 being complete control and 0 indicating control of no GOP seats). The value of 1 is then subtracted from this number, and then the absolute value of the result of the subtraction is calculated to determine the degree to which a state legislature is evenly-divided on a scale of 0 to 1. The higher the number, the more dominated by one party the state legislature is given the breakdown of seats by party. For example, consider a state has a state house with 100 representatives and a state senate with 50 members. If the Republicans control 90 seats in the state house and 40 seats in the state senate, with Democrats controlling the balance of the seats, then the calculation would be 0.90 (90 percent of state house seats) plus 0.80 (80 percent of state senate seats), minus 1.
|((40/50)+(90/100))-1| = |(0.80 + 0.90)-1| = |0.70| = 0.70
The absolute value of this number (which is positive, so finding the absolute value has no effect) provides us with a value on a scale of 0 to 1 that shows the degree of one-party dominance; in this case, the number is 0.7, which shows a high degree of dominance. If the same state had 25 Republicans and 25 Democrats in the senate and 50 Republicans and 50 Democrats in the house, then the calculation should be 0.50 plus 0.50 minus 1, with the absolute value of that being 0, showing no party dominance.
|((25/50)+(50/100))-1| = |(0.50 + 0.50)-1| = |0| = 0
Consider the same state with Democrats in control, with 30 seats in the senate and 60 seats in the house, with Republicans taking the balance of the seats. The absolute value calculation allows the dominance of either party to be measured without considering which party is the one that is dominant.
|((20/50)+(40/100))-1| = |(0.40 + 0.40)-1| = |-0.20| = 0.20
A state legislature which is split between two parties will make the state appear more competitive. This report considered that a reasonable assumption, as split-party control is likely an indication that both parties are strong in the state. Consider the example state used above where Democrats control 30 of the state senate seats (with Republicans given the balance) and Republicans control 90 of the state house seats.
|((20/50)+(90/100))-1| = |(0.40 + 0.90)-1| = |0.30| = 0.30
All data to develop this proxy number for party dominance was collected by Ballotpedia staff and is organized on the partisan composition of state houses and partisan composition of state senates pages. Nebraska, which has a nonpartisan, unicameral legislature, was exempt from this portion of the analysis.
Regression Analysis
This report uses ordinary least squares regressions to explore the relationships between these sets of data.
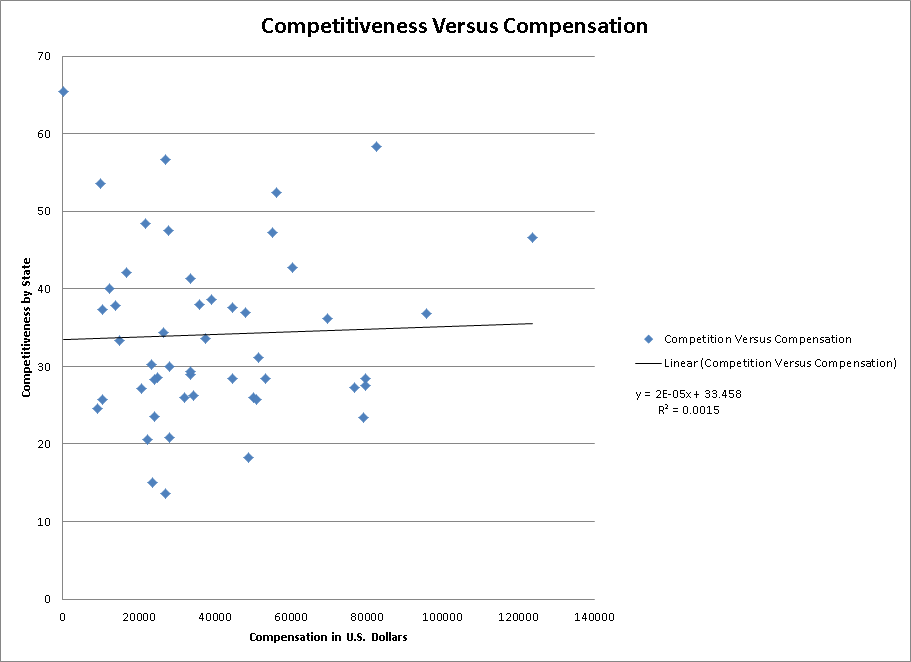
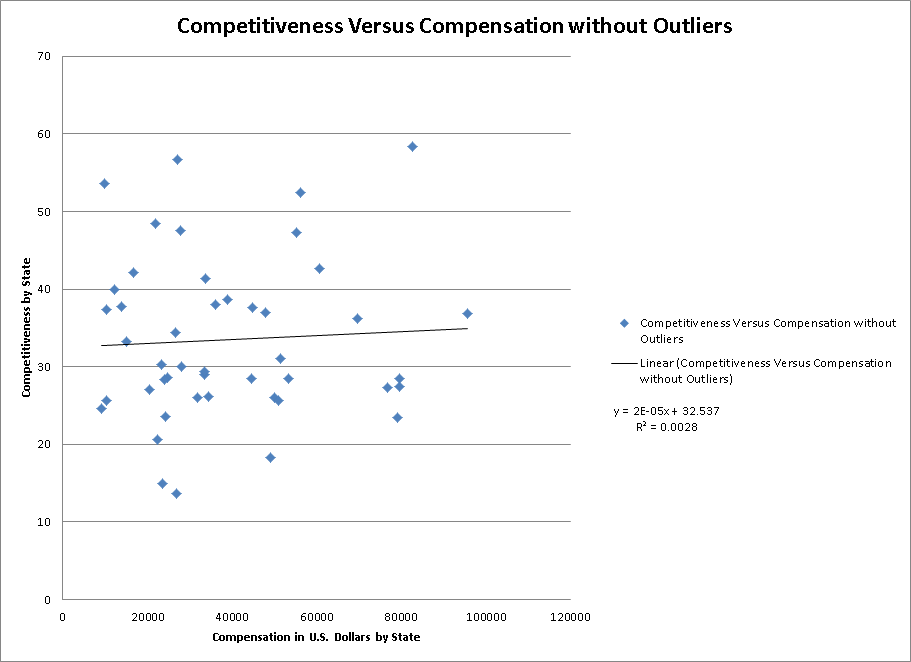
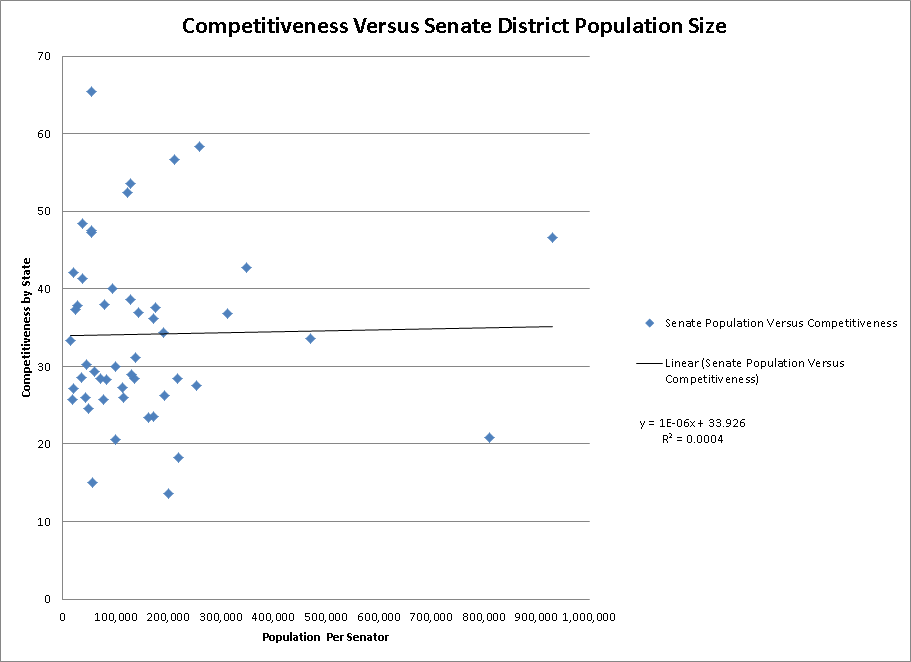
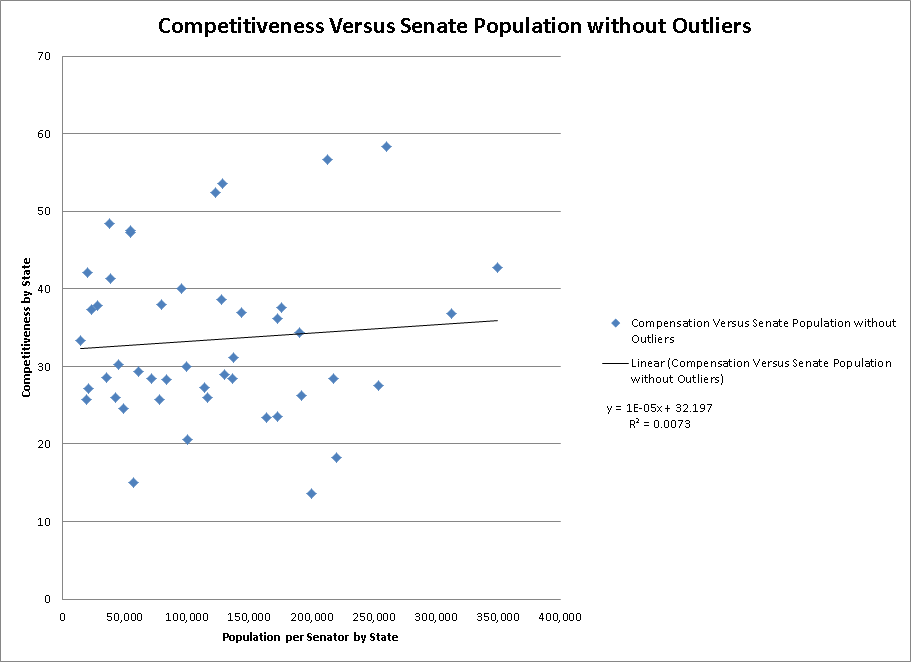
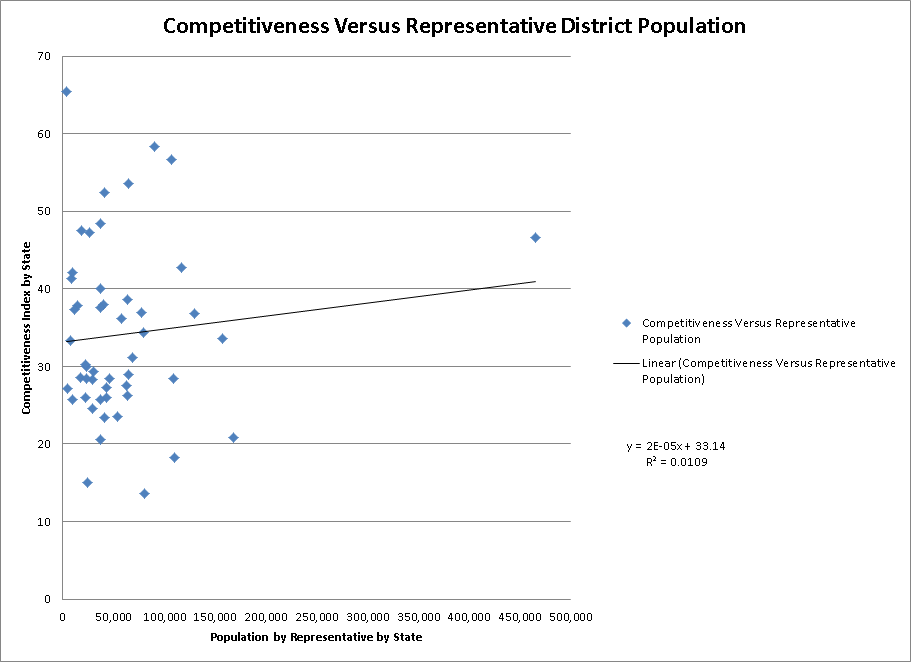
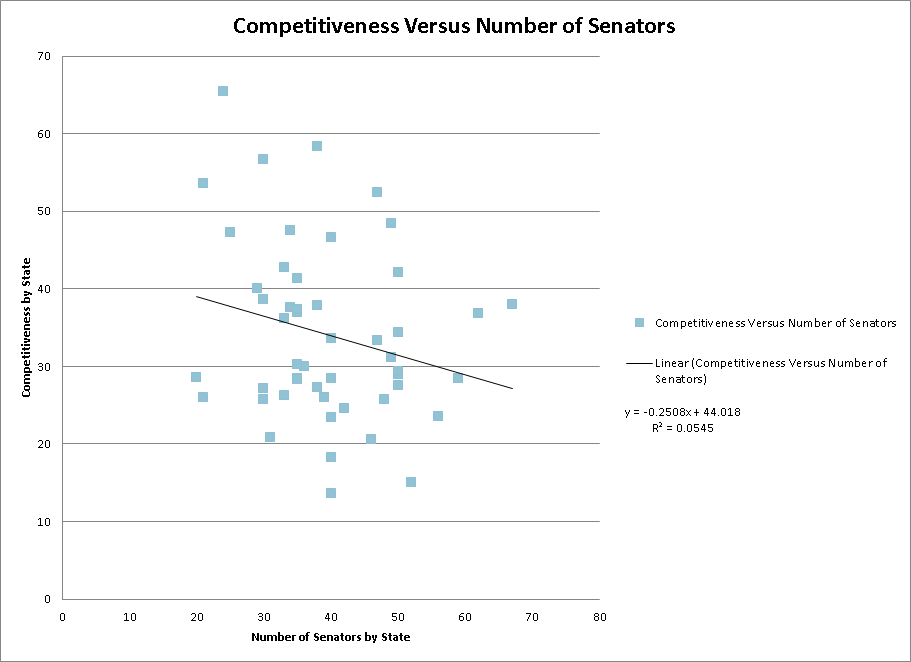
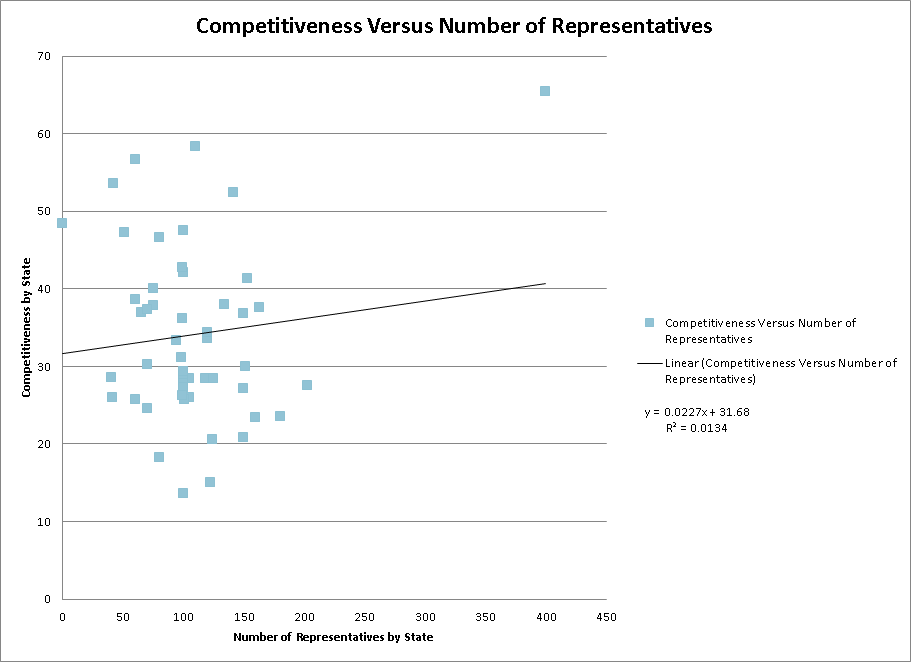
First, the Competitiveness Index versus the population sizes for senate districts was analyzed. The Competitiveness Index versus the population sizes for state house districts was also analyzed. Second, the Competitiveness Index versus the compensation levels by state was analyzed. Third, the Competitiveness Index versus the total number of senators, and then versus representatives, were analyzed as another proxy measure for district size to explore any "optimal chamber size" of competitiveness. Fourth, the first two sets of comparisons in this list were considered without the population and/or compensation outliers of California, Florida, Texas, and New Hampshire. Fifth, the Competitiveness Index versus the proxy number for party dominance was analyzed.
Results
CompensationCompensation without OutliersSenate District Population SizeSenate Population Without OutliersRepresentative District Population SizeRepresentative Population Without OutliersNumber of SenatorsNumber of RepresentativesParty Control |
Analysis
All of the relationships explored in this report are, according to this simple but revealing analysis, very weak. The highest R-squared value found, 0.0545 for the analysis of the Competitiveness Index versus the Number of State Senators, suggests that less than six percent of the variation in competitiveness can be explained by changes in the independent variables (compensation, district population size, or size of the chamber) through a linear relationship. No other relationships (quadratic, exponential, sinusoidal) appear to explain any of these relationships extremely well. A test of a quadratic equation on Competitiveness versus Representative District Population Without Outliers, which visually suggested that a weak quadratic relationship might exist, yielded no practically significant results.
The directions of the relationships were also unclear and often weak. The largest slope in magnitude using a comparable scale, -0.25 on Competitiveness Index versus the Number of State Senators, suggests that an increase in size of a state senate by one senator is correlated with a decrease in the Competitiveness Index score by 0.25. All of the other directional relationships are smaller in magnitude. However, this result neither matches nor has any strong implications for this report's theoretical framework, as both the compensation and the resources required to challenge an incumbent state senator electorally vary widely regardless of the number of state senators serving in a chamber.
The analysis of the effect of state party dominance on competitiveness did not yield any insightful explanatory variable. The regression line actually trended in the opposite direction than was theorized, and states with higher levels of dominance tended to have higher levels of competitiveness. This trend could be due to any number of factors, including increased importance of primaries in one-party states, citizen frustration with one-party and incumbent-candidate dominance (leading to more token opposition candidates satisfied to fill a previously empty space on the ballot), or easier recruitment by minority parties because the "risk" of winning, and thus the onus to campaign and expend resources, as a minority party candidate is small. However, less than five percent of the change in competitiveness can be directly attributed to the change in party dominance of state legislatures, so informed conjecture would require more data.
Further Research and Conclusion
These simple ordinary least squares regressions do not yield a significant relationship between compensation and competitiveness, district size and competitiveness, or party dominance and competitiveness. Both the theories that higher salaries lead to more competitiveness and smaller districts lead to more competitiveness are not supported by this analysis. The theory that increased one-party dominance reduces competitiveness is also not supported by this analysis. However, the significance of the variable coefficients should be tested with more data and more powerful statistical tools before these theories are abandoned. Multivariate regressions should be used to test the relationship between both independent variables and the dependent variable simultaneously. Multivariate regressions would also allow researchers to control for potential lurking variables, including geographic size of district, partisan voting patterns of each district or state over time, and measures of economic diversity in each district.
These simple regression analyses, however, suggest that a clear, simple relationship between either district size, compensation offered to representatives, or party control and the competitiveness of elections likely did not exist in the 2010 and 2011 elections.
See also
- Population represented by state legislators
- Party dominance in state legislatures
- Comparison of state legislative salaries
- A "Competitiveness Index" for capturing competitiveness in state legislative elections
- Creating an absolute measure for the "Competitiveness Index" in state legislative elections
Footnotes
- ↑ Gallup, "Confidence in Institutions," June 20, 2012
- ↑ National Journal, "In Nothing We Trust," April 26, 2012
- ↑ Gallup, "In U.S., Local and State Governments Retain Positive Ratings," October 3, 2011
- ↑ Gallup, "In U.S., Fear of Big Government at Near-Record Level," December 12, 2011
- ↑ 5.0 5.1 5.2 5.3 National Conference of State Legislators, "Most legislative salaries lag behind the private sector, but raising them can cause a political firestorm," January 2011
- ↑ Public Policy Institute of California, "Data Set: PPIC Statewide Survey - Time Trends for Job Approval Ratings," accessed July 14, 2012
- ↑ The Huntsville Times, "Constitutional amendment would reduce Alabama legislators' pay if voters approve in November," June 27, 2012
- ↑ New Hampshire Magazine, "Legislature on Leave," July 1, 2012
- ↑ Georgia Secretary of State, "Historical Roster of the Governors of Georgia," accessed 29 July 2012
- ↑ Vermont Historical Society, "Mountain Rule Revisited," 2003, accessed 29 July 2012
- ↑ The Economist, "The Long Goodbye," November 11, 2010
- ↑ Ken Collier, Steven Galatas, and Julie Harrelson-Stephens, Lone Star Politics, "Chapter 7. Elections: Texas Style," accessed July 29, 2012
- ↑ ACE, "Parties and Candidates," accessed July 29, 2012
- ↑ WMUR Political Scoop, "Political Standing for June 15, 2012," June 15, 2012
- ↑ The Huffington Post, "GOP Primary Draws Parallels To Obama-Hillary Clinton 2008 Fight," March 1, 2012
- ↑ National Conference of State Legislatures, "2011 NCSL Legislator Compensation Table," accessed July 15, 2012
| |||||||||||
| |||||||||||||||||||||||||||||||||||||||||||||||||||||||


